Note
Click here to download the full example code
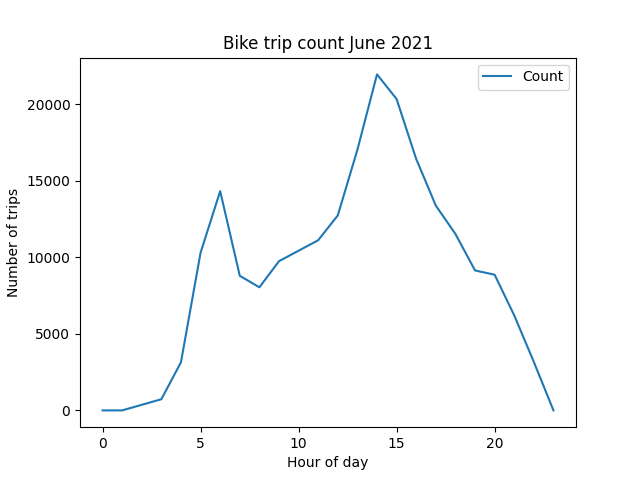
Plotting number of trips per hour
A simple script to show how you can plot the hourly trips with the bike sharing service in Oslo.
Setup
import matplotlib.pyplot as plt
import oslobike
from math import pi
Fetch bike sharing data
data = oslobike.get_historical(6, 2021)
Count number of trips per hour
data["Count"] = 1
hourly_data = data.groupby(data["started_at"].dt.hour).sum()
Plot the trips
fig, ax = plt.subplots()
hourly_data.plot(y="Count", ax=ax)

# Make plot pretty
ax.set_xlabel("Hour of day")
ax.set_ylabel("Number of trips")
ax.set_title("Bike trip count June 2021")

plt.show()
Total running time of the script: ( 0 minutes 5.379 seconds)